
Introduction
Successful stock market trading is not just about identifying which direction a stock might move. It is also about finding the right time to enter a trade, managing risk, and following a consistent strategy. Two popular approaches traders use to identify entry opportunities are breakout trading and pullback trading.
Both strategies aim to capture price movements, but they approach the market differently. Breakout traders look for prices moving beyond important support or resistance levels, while pullback traders wait for prices to temporarily retrace before continuing in the direction of the prevailing trend.
Understanding the difference between these strategies can help traders make more informed decisions, avoid emotional entries, and develop a trading approach that suits their personality and risk tolerance.
In this guide, we will explore how breakout and pullback trading work, their advantages and disadvantages, and how you can identify potential setups in the stock market.
What Is Breakout Trading?
Breakout trading is a strategy that focuses on price movements beyond established support, resistance, or consolidation zones.
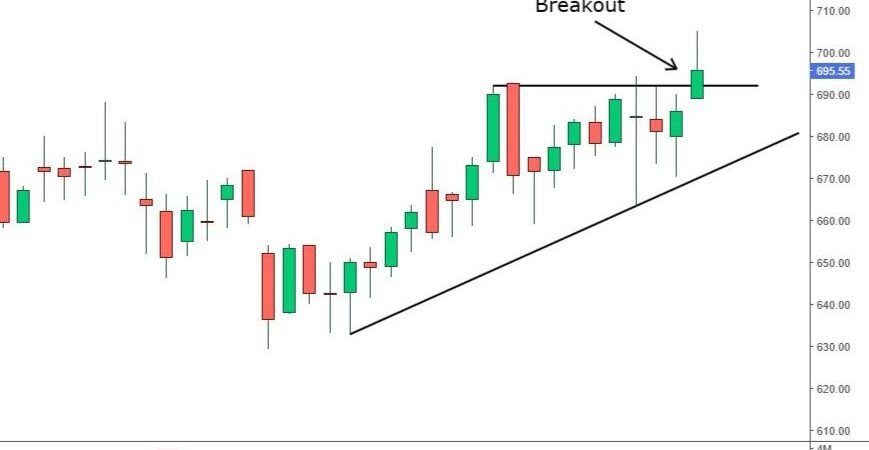
A breakout occurs when a stock moves above a resistance level or below a support level. Traders watch these areas because a strong move beyond them may indicate that the market is preparing for a new directional movement.
For example, imagine a stock has repeatedly struggled to move above $100. Each time the price approaches that level, selling pressure pushes it lower. Eventually, the stock rises above $100 with strong trading volume.
A breakout trader may interpret this move as a potential buying opportunity because the stock has moved beyond a level that previously limited its price.
How to Identify a Breakout Setup
Traders commonly look for the following conditions:
- Clear support or resistance: The price has tested an identifiable level multiple times.
- Price consolidation: The stock trades within a relatively narrow range before making a move.
- A decisive price move: The candle closes beyond the important level rather than briefly moving above or below it.
- Volume confirmation: Trading volume increases, potentially indicating stronger participation.
- A defined risk level: The trader identifies where the breakout idea would be invalidated.
These factors can strengthen a breakout setup, but none guarantees that the price will continue in the breakout direction.
The Problem of False Breakouts
One of the biggest challenges in breakout trading is the false breakout.
A false breakout happens when the price moves beyond a significant level but quickly returns to its previous trading range. Traders who enter too early may find themselves in losing positions.
For example, a stock might move above resistance at $100 and reach $102, encouraging traders to buy. However, selling pressure returns, and the price falls back below $100.
To reduce this risk, some traders wait for a candle to close beyond the level, observe volume, or wait for a retest before entering. These methods may help filter certain weak breakouts, although they cannot eliminate false signals.
What Is Pullback Trading?
Pullback trading involves entering a trade after the price temporarily moves against the prevailing trend.
In an uptrend, a stock typically creates higher highs and higher lows. Instead of buying when the price is rising sharply, a pullback trader waits for a temporary decline toward a potential support area before considering a long position.
The goal is to enter closer to a potential support level rather than chasing an extended price move.
For example, suppose a stock rises from $80 to $100, then declines to $94. If the broader uptrend remains intact and the price shows signs of renewed buying interest near a relevant support area, a trader may consider entering around that region.
The important point is that a pullback is not automatically a buying opportunity. The price could continue falling and develop into a deeper correction or a complete trend reversal.
How to Identify a Pullback Setup
A potential pullback setup may include:
- An established trend: The stock shows a recognizable upward or downward structure.
- A retracement: The price temporarily moves against the main trend.
- A potential support or resistance zone: The pullback approaches a previous breakout level, moving average, trendline, or other relevant area.
- Confirmation: Price action suggests that the original trend may be resuming.
- A clear invalidation point: The trader identifies the price level that would challenge the original trade idea.
For an uptrend, traders typically look for buying opportunities after a pullback. In a downtrend, they may look for short-selling opportunities after an upward retracement, where short selling is permitted and appropriate.
Breakout vs. Pullback Trading: Key Differences
Although both strategies can be used in trending markets, their entry conditions are different.
| Feature | Breakout Trading | Pullback Trading |
|---|---|---|
| Entry approach | After price breaks an important level | After price retraces within a trend |
| Main focus | Momentum and expansion | Trend continuation after a retracement |
| Typical entry | Beyond support or resistance | Near a potential support or resistance zone |
| Common risk | False breakouts | Pullback becomes a reversal |
| Potential advantage | Captures early momentum after a breakout | May provide a more favorable entry price |
| Main challenge | Avoiding weak or premature breakouts | Waiting patiently for confirmation |
Neither strategy is universally better. Performance depends on market conditions, execution, risk management, and the trader’s ability to follow consistent rules.
Which Strategy Works Best in Different Market Conditions?
Choosing between breakout and pullback trading begins with understanding the market environment.
1. Strong Trending Markets
In a strong uptrend, both strategies may offer opportunities.
Breakout traders can look for price moving above a consolidation range or a previous swing high. Pullback traders can wait for the price to retrace toward a potential support area before looking for trend continuation.
For example, if a stock rises steadily and consolidates between $110 and $115, a move above $115 may attract breakout traders. If the stock breaks above $115 and later returns to test that area, a pullback trader may watch for a potential entry near the former resistance level.
The same price structure can therefore create opportunities for both approaches at different stages.
2. Sideways Markets
Sideways markets can be challenging for breakout traders because prices may repeatedly move above resistance or below support before returning to the range.
Pullback trading can also be difficult when there is no clear trend to follow.
In these conditions, traders should avoid forcing setups and may choose to wait for a clearer market structure.
3. Highly Volatile Markets
During earnings announcements, major economic releases, or unexpected company news, stock prices can move sharply in either direction.
Breakouts may occur quickly but reverse just as fast. Pullbacks can become deeper than expected, making stop-loss placement and position sizing especially important.
Traders should account for potential slippage, wider price swings, and sudden changes in market sentiment.
How to Combine Breakout and Pullback Trading
Some traders use both approaches as part of one trading plan.
A common method is to identify a breakout first and then wait for a pullback toward the broken level.
Consider this hypothetical example:
- A stock trades between $45 and $50 for several sessions.
- The price closes above $50, creating a potential bullish breakout.
- Instead of buying immediately, the trader waits to see whether the price returns toward $50.
- The stock tests the area and shows signs of buying interest.
- The trader evaluates a potential entry, stop-loss level, and realistic profit target.
This approach combines breakout analysis with pullback confirmation. The former resistance level may become a support area, although this transition is not guaranteed.
If the stock falls decisively back into the previous range, the breakout thesis may be weakened or invalidated.
Importantly, waiting for a pullback means the trade might never trigger. The price could continue rising without revisiting the breakout level. Missing a trade is generally preferable to abandoning a trading plan simply out of fear of missing out.
Risk Management: The Most Important Part of Both Strategies
Even a well-planned breakout or pullback trade can fail. That is why risk management should come before profit expectations.
Consider a hypothetical account worth $5,000. If a trader chooses to risk 1% of the account on one trade, the maximum planned risk is $50.
If the entry price is $25 and the planned stop-loss is $24, the risk per share is $1. Ignoring fees and slippage, a $50 risk budget would allow a position of up to 50 shares.
However, the actual position size should also account for trading costs, potential gaps, liquidity, and the possibility that the stop-loss may execute at a worse price than expected.
Other useful risk-management practices include:
- Define the entry, stop-loss, and exit conditions before placing a trade.
- Avoid risking too much capital on a single setup.
- Do not move a stop-loss farther away simply to avoid realizing a loss.
- Avoid entering trades solely because a stock is moving quickly.
- Keep a trading journal to review the quality of your decisions.
- Evaluate results across a meaningful sample of trades rather than judging a strategy from one or two outcomes.
Common Mistakes to Avoid
Beginners often struggle with both strategies because they focus on entries without understanding the broader market structure.
Buying every breakout: Not every move above resistance signals a sustainable upward trend.
Entering pullbacks too early: A declining stock may continue falling rather than resume its uptrend.
Ignoring trading volume: Volume can provide useful context, although it should not be treated as a guarantee of future movement.
Using inconsistent rules: Changing entry conditions from trade to trade makes performance difficult to evaluate.
Ignoring the risk-to-reward relationship: A trade may have a high probability of success but still be unattractive if the potential reward is too small relative to the risk.
The solution is to develop specific trading rules, test them using historical data, and practice them in a simulated environment before committing significant capital.
Conclusion
Breakout and pullback trading are two useful approaches to understanding stock market price movements. Breakout trading focuses on price moving beyond important levels, while pullback trading seeks opportunities after a temporary retracement within an established trend.
Breakouts may suit traders who prefer momentum-based entries, while pullbacks may appeal to those who prefer waiting for a retracement and confirmation. Some traders combine both methods to identify a breakout and then look for a potential retest.
Ultimately, no trading strategy works in every market condition. Consistent execution, realistic expectations, careful position sizing, and disciplined risk management are more important than finding a supposedly perfect entry signal.
If you want to strengthen your understanding of technical analysis, market structure, support and resistance, and practical trading strategies, explore our trading courses to build your knowledge step by step.
Disclaimer: This article is for educational and informational purposes only and should not be considered financial or investment advice. Stock market trading involves risk, and losses can exceed expectations. Always conduct your own research and assess your financial situation before making trading decisions.
